Field Crops Research
July 2024
High-throughput physiological phenotyping of crop evapotranspiration at the plot scale
Geng (Frank) Bai, Burdette Barker, David Scoby, Suat Irmak, Joe D. Luck, Christopher M.U. Neale, James C. Schnable, Tala Awada, William P. Kustas, Yufeng Ge
Read the article
PSI researchers and their colleagues develop a method for remotely estimating crop water use and drought response
The combined effects of heat stress and drought have led to significant global crop yield reductions at a time when a rapidly growing population increases demand for food production. Climate factors, along with the complex interactions between the atmosphere, soil moisture, and plant physiology, require us to better understand their impacts on crop yields across diverse scales so that researchers can develop drought resistant crops. One key area of study for plant physiologists and breeders is the impact of those interactions on plant phenotype under field conditions.
One of those interactions, evapotranspiration, is difficult to measure at the small plot scale. Evapotranspiration (ET)—the amount of water going into the atmosphere from soil evaporation and plant transpiration—is a critical measurement for understanding plant physiology. Measuring ET related traits as part of phenotyping enables quantification of plot-scale water use at specific times during the growing season and more accurate prediction models for crop carbon assimilation and yield.
ET can be measured using several methods. The eddy covariance method is complex and requires a larger footprint than a breeding plot. Another method, models that use weather data and crop coefficients, depends on the availability of local coefficients and weather data. Remote sensing (RS), which is used to model ET at widely varying spatiotemporal scales, may be a better option for plot-scale measurements.
One RS-based methodology, two-source energy balance (TSEB) model, appealed to PSI faculty Yufeng Ge for measuring plot-scale ET. It’s a two-source model because it separates the contribution of the soil and canopy temperatures to the composite radiometric temperature. Ge thought that TSEB models could potentially measure instantaneous ET for individual breeding plots.
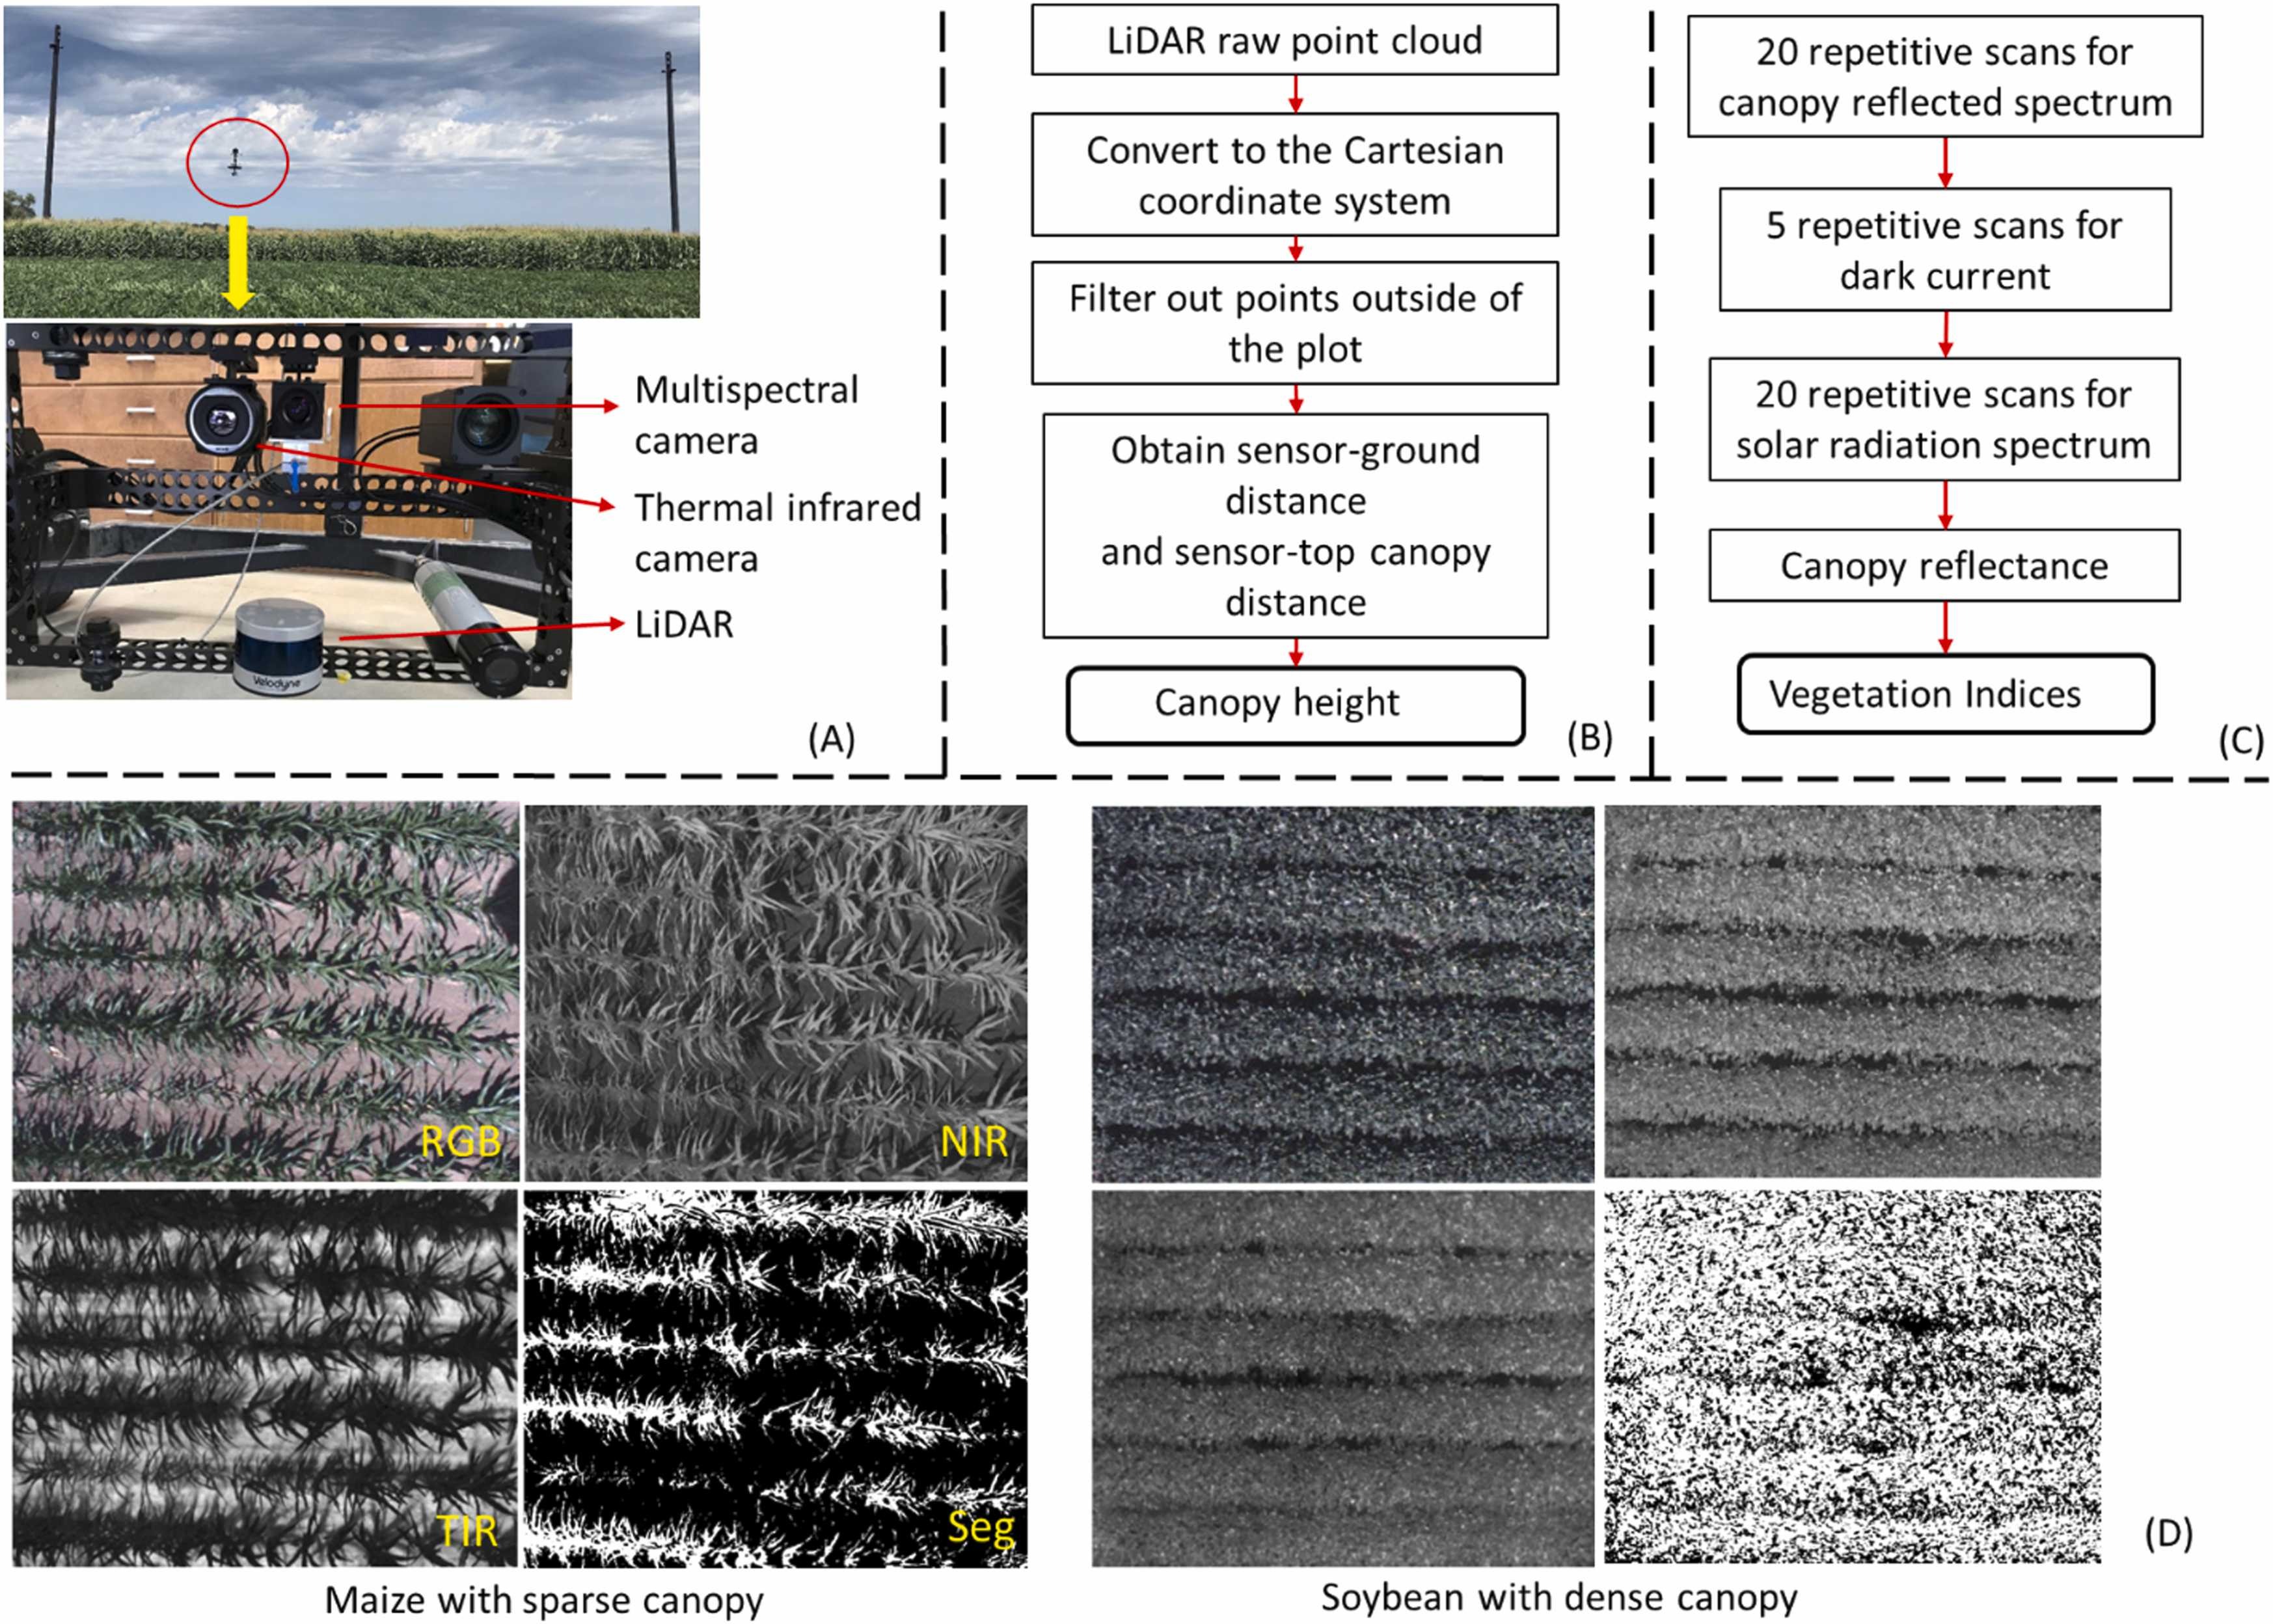
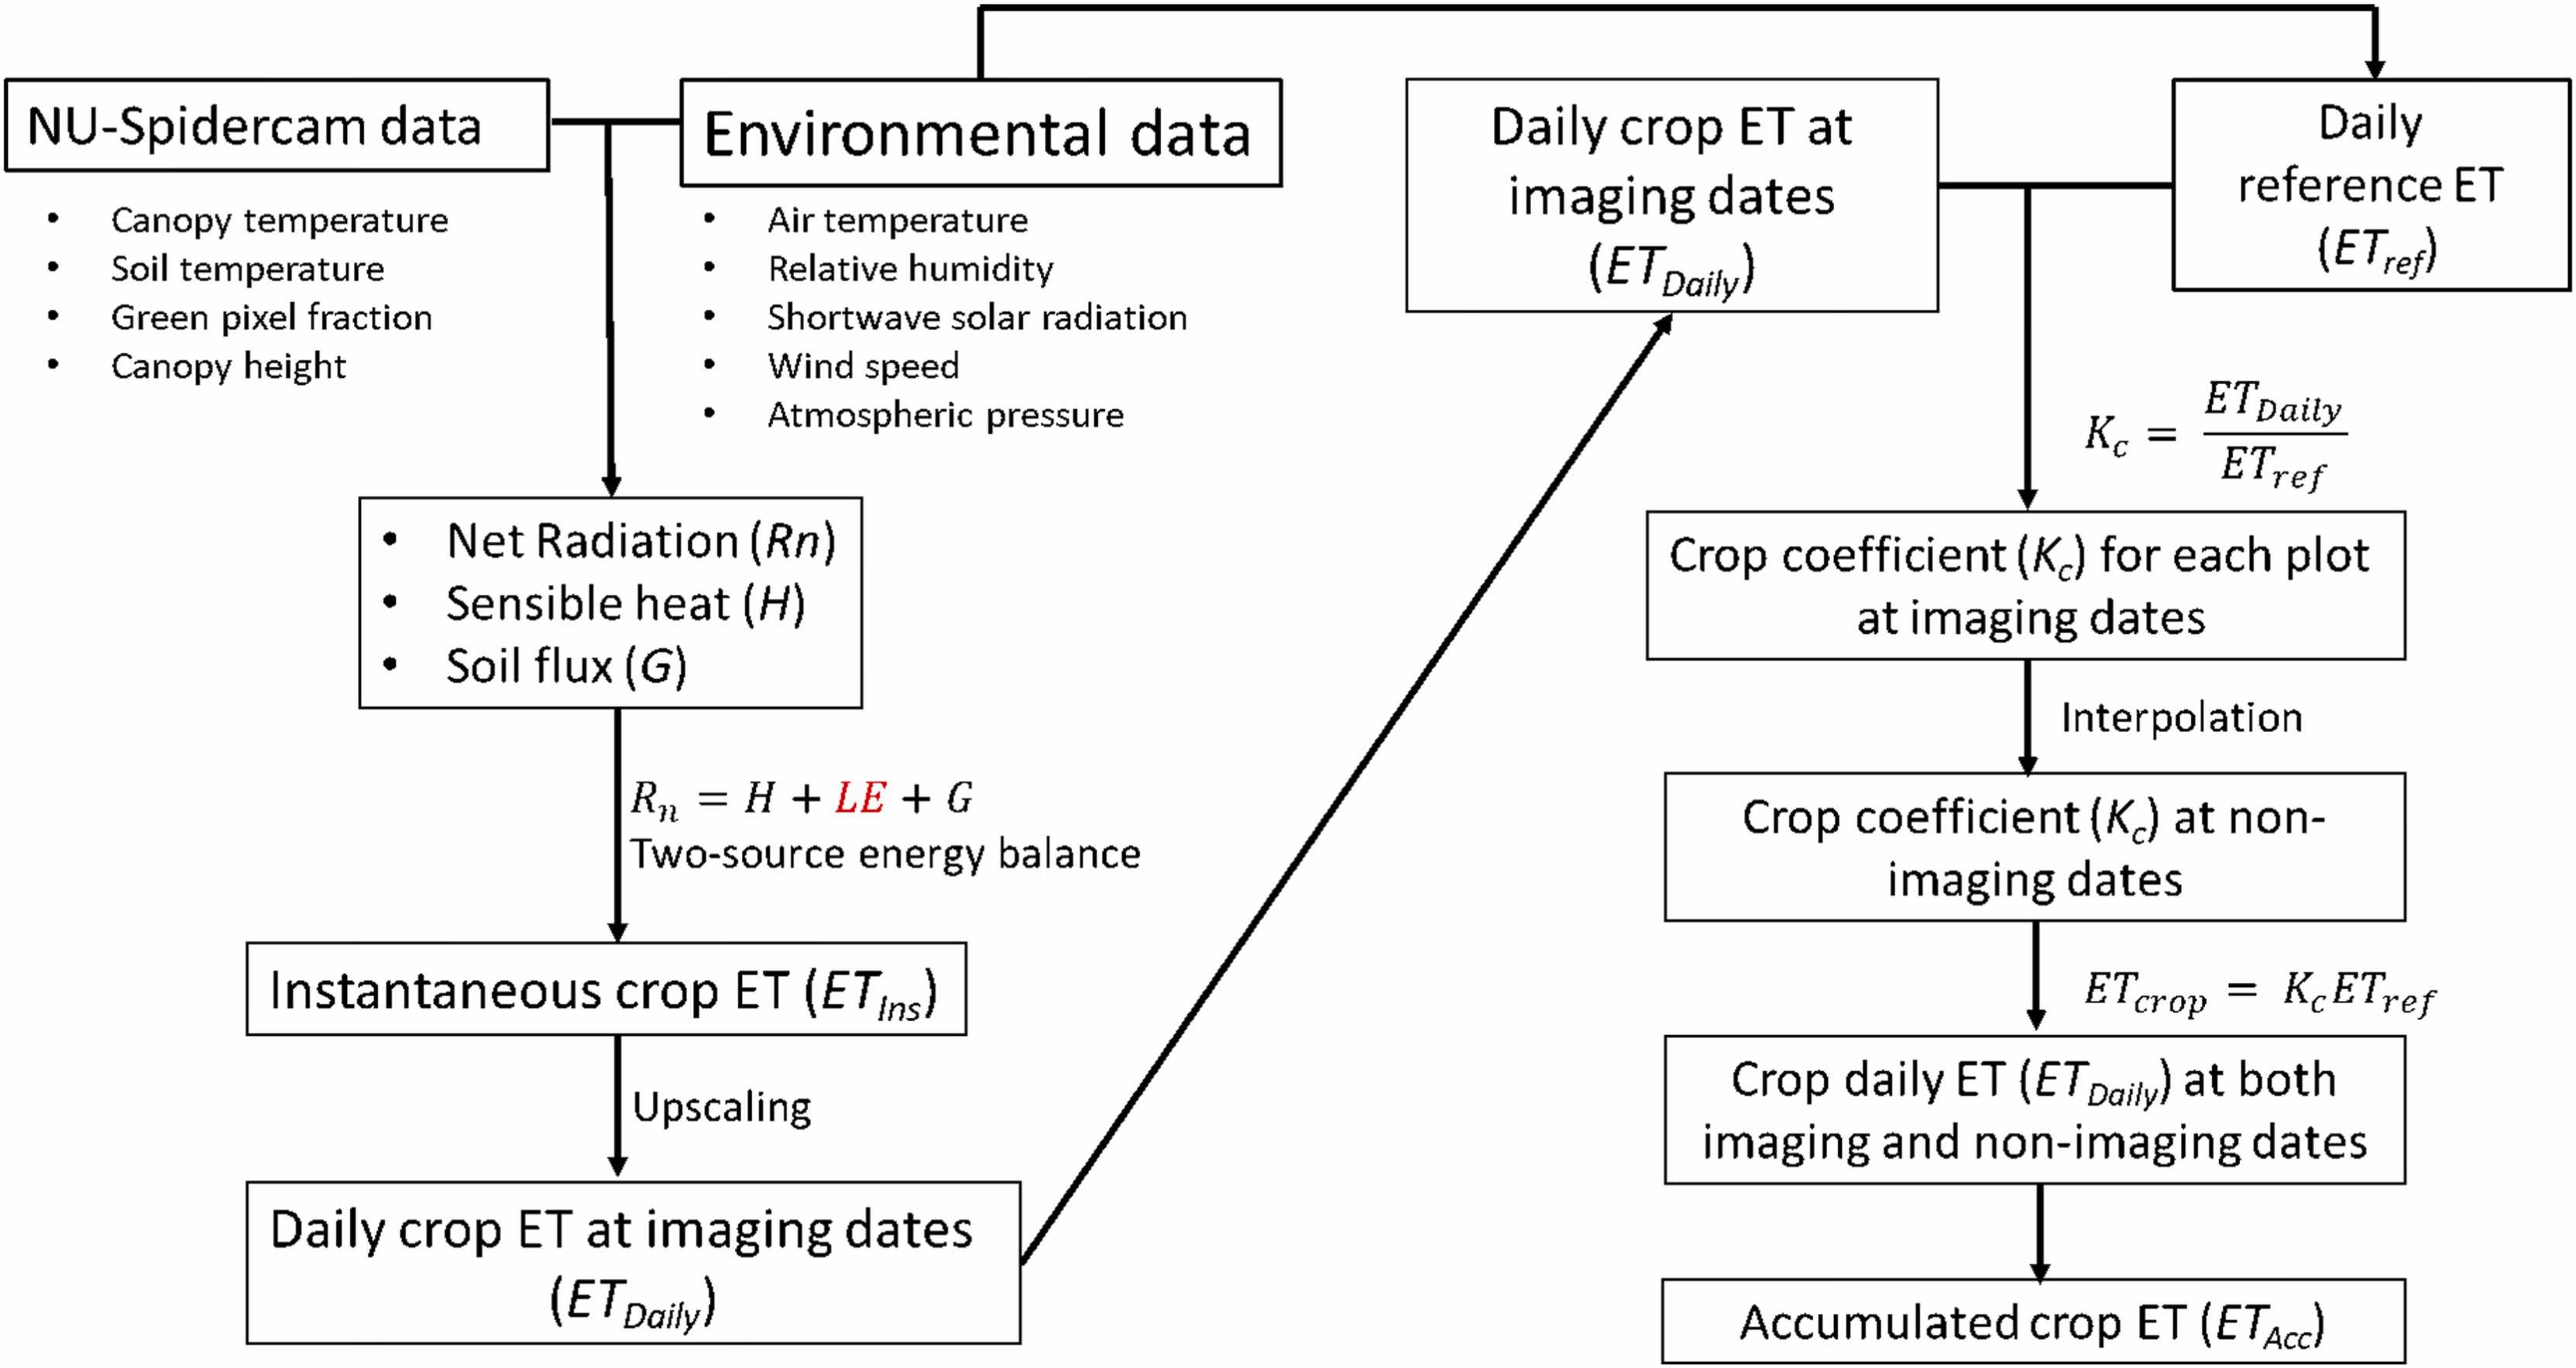
The researchers developed a computational framework to estimate plot-scale ET using images from the Field High Throughput Plant Phenotyping (FHTPP) platform NU-Spidercam, TSEB, and reference ET models. Phenotypic traits from the sensors on the NU Spidercam and data from the weather station at the site were put into a simplified TSEB model to instantaneously estimate ET for each plot. They evaluated those ET measurements against grain yield in a two-year field experiment that included both subsurface drip irrigated and rainfed plots. The varying irrigation treatments were meant to create variations in crop water use that could be differentiated and estimated with the new framework.
They measured ET frequently through two growing season, which allowed more reliable upscaling to daily ET through interpolation. Their investigation showed that the frequent imaging capacity of high-throughput phenotyping appears important for the performance of plot-scale ET traits.
Results showed differences in plot-scale ET among the treatments, with irrigated plots showing higher ET than rainfed plots. The divergence in ET between the irrigated and rainfed plots was highest mid-season when plants were in their growth stages of high demand for water. Since the irrigation was sub-surface, they concluded that canopy transpiration made the major contribution of the ET difference between the rainfed and irrigated plots.
They saw strong linear correlations between plot-scale ET and grain yield, and ET appeared to be a better predictor of grain yield than other morphological and spectral traits. ET was also steadier than other in-season measured traits that fluctuate significantly in their correlation with yield. This allowed the researchers to see and understand the in-season dynamics of crop water use and its relationship to yield.
Although this study collected data with an expensive research facility (NU-Spidercam), the researchers expect their method could be applied on drones and some ground platforms at a lower cost with the right multispectral and infrared cameras. This would increase researchers’ ability to phenotype water-related traits and address challenges related to field-based evaluation of drought tolerance and water use efficiency and shed light on the underlying genetics. With this method, they could potentially estimate crop water consumption, construct yield prediction models, and screen for drought-tolerant genotypes. Other possible applications include growers’ use for tailoring irrigation to crop drought response.